


First published on April 15, 2021
Previously, we described the power of Artist Market Value (“AMV”) and then introduced the AAA 100 as the S&P 500 of the art market. Institutions and high-end collectors will want to know two things: How did I do? and How did I do against the market? Here, we are focusing on the second question and comparing the performance of our unnamed blue-chip artist’s AMV to that of the AAA 100. Benchmarking has many uses, but it’s best at bringing matters of risk and return into focus.
How does benchmarking work and what it tells us
In this case, the results are surprising, even counterintuitive. You would think that a blue-chip artist’s performance would closely align with that of the AAA 100 Index and not exhibit much volatility. That is not the case here; instead, we get the performance profile more typical of emerging, less established artists.
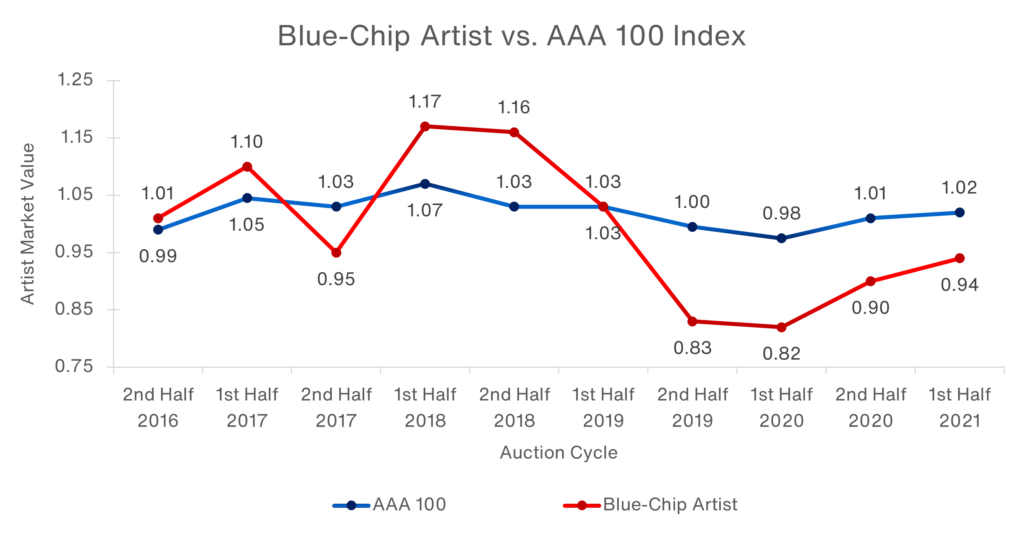
The chart highlights the blue-chip artist’s riskiness:
- A pattern of below-market performance, with AMV at a 12% discount to the AAA 100 at the end of 2020.
- Volatility atypical of an established, blue-chip artist.
- Little, if any, correlated movement with the market.
Next up, using sub-indexes to provide more direct comparisons and add color. In the meantime, if there are any artists, indexes, or topics you want to see, let us know.


0 Comments