our advantage
A New Valuation Standard
AMV sets Art Auction Analytics apart. It is the only quantitative solution that uses an objective standard to calculate the market value of an artist.
a comprehensive expression of value
Artist Market Value (“AMV”)
AMV is our calculation of an artist’s value in the market. The calculation incorporates a three-step process:
Step 1
Source transaction results from the major auction houses.

Step 2
Calculate the six relevant Key Performance Metrics (“KPMs”).

Step 3
A standard algorithm aggregates and weights the KPMs to calculate the AMV.
Your Standard Market Value Calculation for Artists and Artworks
AMV is our proprietary, composite calculation that gives you an artist’s and artwork’s value in the market:
-
First, it analyzes an artist's individual performance at auction.
- Then, it expands to include a comparative analysis of auction performance that places the artist in the context of other artists.
- Finally, it analyzes and incorporates the performance of an artist's market and movement
Sophisticated Financial Analysis Applied to Art
AMV is a holistic calculation. It incorporates five years of historical transaction data, and considers six Key Performance Metrics (“KPMs”), for a complete picture of an artist’s value.
By not using AMV, you are relying on partial value information for making decisions on artists and their artworks.

the building blocks of value
Key Performance Metrics (“KPMs”)
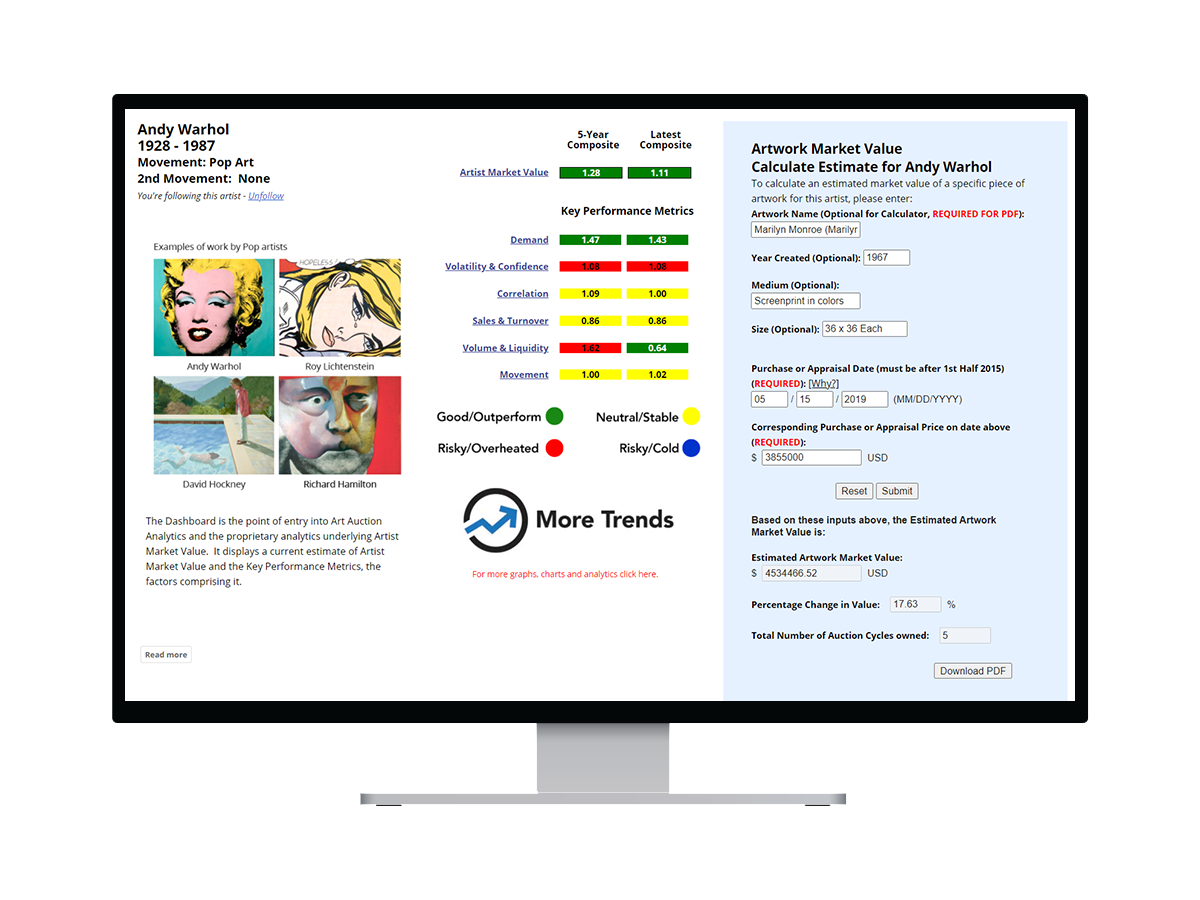
AMV is more than a single figure. It is a composite of six Key Performance Metrics (“KPMs”). The KPMs show you which artists collectors are investing in.
The KPM’s underlying the AMV are:
Demand
Actual vs. pre-sale estimates
Gauges buyer willingness to pay a premium or a discount.
Sales & Turnover
Overall market sales vs. pre-sale estimates
Identifies the relative strength of the art market.
Volatility & Confidence
Percentage of lots sold
Evaluates overall buying interest.
Volume & Liquidity
Number of lots sold at auction
Measures the artist’s liquidity in the art market.
Correlation
Artist’s demand versus that of the movement and market
Places the artist in the context of the market.
Movement
Movement demand versus similar movement and market demand
Assesses if an art sector is in or out of favor.
the components of value
The Importance of KPMs
- KPMs enable you to get behind AMV and understand how the key components of value come together.
- KPMs are measurable and they give you the “why”.
- KPMs allow you to make investment decisions based on performance indicators that fit your investment style.

a complete picture of the value
Aggregation is a Key Fundamental
To ensure the most accurate calculations, AMV and the KPMs are based on the total transaction data available for an artist. Data is aggregated at the artist level to capture a complete picture of the artist’s performance.
We do this because auctions don’t happen every day. Throughout the year they vary in size, the number of artists and lots included, and the dollar amounts of the works offered. However, the major Auction Types tend to happen bi-annually and in the same time frame each year. For example, the significant Post-War and Contemporary New York evening auctions take place in mid-May and mid-November; while the major American auctions occur in late May and late November.
Our six-month Auction Cycles, corresponding to the first six months and last six months of a calendar year, translate into meaningful metrics. The artist AMV and KPMs are calculated for these time periods. The aggregation results in a comprehensive valuation for each artist and allows for useful year-over-year comparisons.


different views of value
5-Year Composite and Latest Composite Data
Our AMV and KPM data is parsed in two ways in order to provide actionable information:
5-YEAR COMPOSITE reflects five years of artist performance weighted more heavily over the most recently completed Auction Cycle.
LATEST COMPOSITE also reflects five years of artist performance data with the current Auction Cycle weighted more heavily. This figure is calculated mid-Auction Cycle and is a strong indicator of direction.